Trajectory: In silico gene perturbation
In the dynamo Cell paper :cite:p:QIU2022, we introduced the analytical form of a
vector field. This permits in silico perturbation predictions of expression
for each gene in each cell and the cell fate diversions after
genetic perturbations. In particular, we demonstrated the predictive
power of hematopoietic fate trajectory predictions after genetic
perturbations.
In this tutorial, we will cover the following topics:
Perturbation functionality and API in
dynamoHow to perturb gene expression levels individually or collectively in hematopoietic scNT-seq dataset
Visualize gene perturbation effects
Reproduce results in
dynamopaper Fig.7 :cite:p:QIU2022
Perturbation method introduction
Import relevant packages
import warnings
warnings.filterwarnings('ignore')
warnings.filterwarnings("ignore", message="numpy.dtype size changed")

import dynamo as dyn

dyn.configuration.set_figure_params('dynamo', background='white')
dyn.pl.style(font_path='Arial')
dyn.get_all_dependencies_version()

%load_ext autoreload
%autoreload 2
Using already downloaded Arial font from: /tmp/dynamo_arial.ttf
Registered custom font as: Arial


 ███                               ████████
█████   █████    █████    █████    ███   █████
   ██████   ██████   ██████   ████████      ████
  ___                           ████            ███
 |   \ _  _ _ _  __ _ _ __  ___                 ███
 | |) | || | ' \/ _` | '  \/ _ \█████           ███
 |___/ \_, |_||_\__,_|_|_|_\___/█████       ████
       |__/                        ███   █████
Tutorial: https://dynamo-release.readthedocs.io/
                                     █████
| package | umap-learn | typing-extensions | tqdm | statsmodels | setuptools | session-info | seaborn | scipy | requests | pynndescent | pre-commit | pandas | openpyxl | numdifftools | numba | networkx | mudata | matplotlib | loompy | leidenalg | igraph | dynamo-release | colorcet | anndata |
|---|---|---|---|---|---|---|---|---|---|---|---|---|---|---|---|---|---|---|---|---|---|---|---|---|
| version | 0.5.7 | 4.13.2 | 4.67.1 | 0.14.4 | 79.0.0 | 1.0.1 | 0.13.2 | 1.11.4 | 2.32.3 | 0.5.13 | 4.2.0 | 2.2.3 | 3.1.5 | 0.9.41 | 0.60.0 | 3.4.2 | 0.3.1 | 3.10.3 | 3.0.8 | 0.10.2 | 0.11.8 | 1.4.2rc1 | 3.1.0 | 0.11.4 |
adata_labeling = dyn.sample_data.hematopoiesis()
|-----> Downloading processed hematopoiesis adata
|-----> Downloading data to ./data/hematopoiesis.h5ad
|-----> File ./data/hematopoiesis.h5ad already exists.
Take a glance at what is in adata object. All observations,
embedding layers and other data in adata are computed within
dynamo. Please refer to other dynamo tutorials regarding how to
obtain these values from the metadata and the raw new/total and (or) raw
spliced/unspliced gene expression values.
Perturb gene expression values
Here we apply dynamo.pd.perturbation() to the dataset by upregulating each gene and creating
visualization plots. In addition, multiple genes can be suppressed or activated
during perturbation simulation.
Induce hematopoietic stem cells with selected TFs
Define sets of genes
Let’s define three sets of genes we explored in :cite:p:QIU2022. For example, during reprogramming committed murine blood cells to induced
hematopoietic stem cells with defined factors, six transcription
factors defined in murine_blood_cells below impart
multilineage transplantation potential onto otherwise committed
lymphoid and myeloid progenitors and myeloid effector cells. You can refer to :cite:p:QIU2022 for more information about these genes.
murine_blood_cells = ["RUN1T1", "HLF", "LMO2", "PRDM5", "PBX1", "ZFP37", "MYCN", "MEIS1"]
gran_lineage_genes = ["CEBPE", "RUNX1T1", "KLF1", "CEBPA", "FOSB", "JUN", "SPI1", "ZC3HAV1"]
erythroid_differentiation = ["GATA1", "TAL1", "LMO2", "KLF1", "MYB", "LDB1", "NFE2", "GFI1B", "BCL11A"]
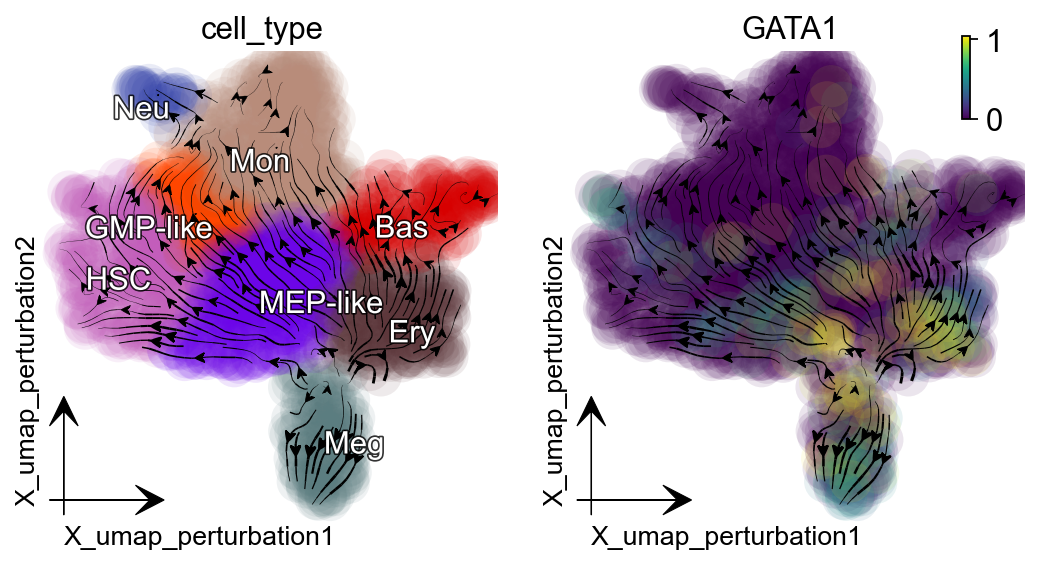
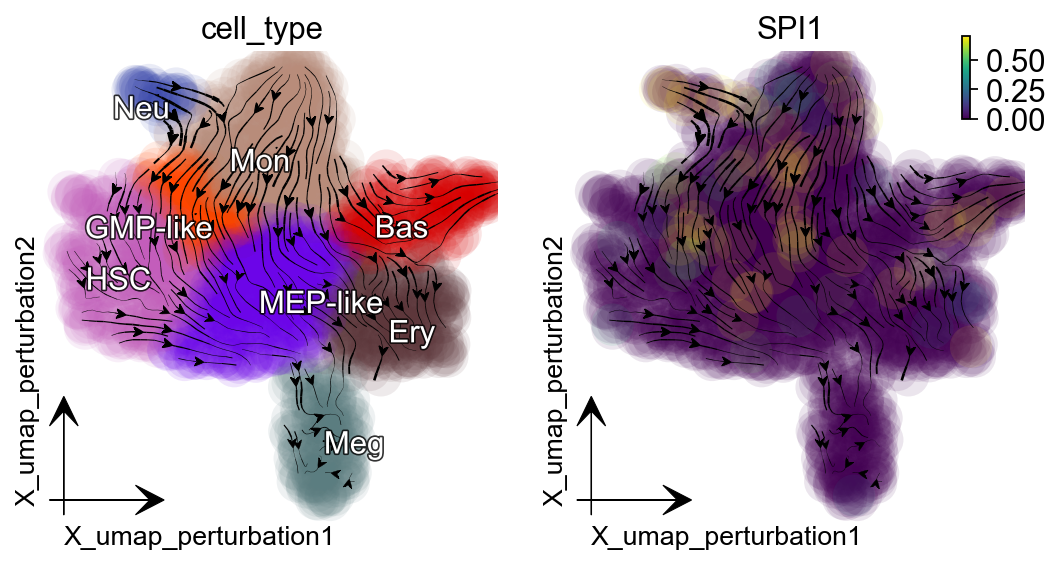
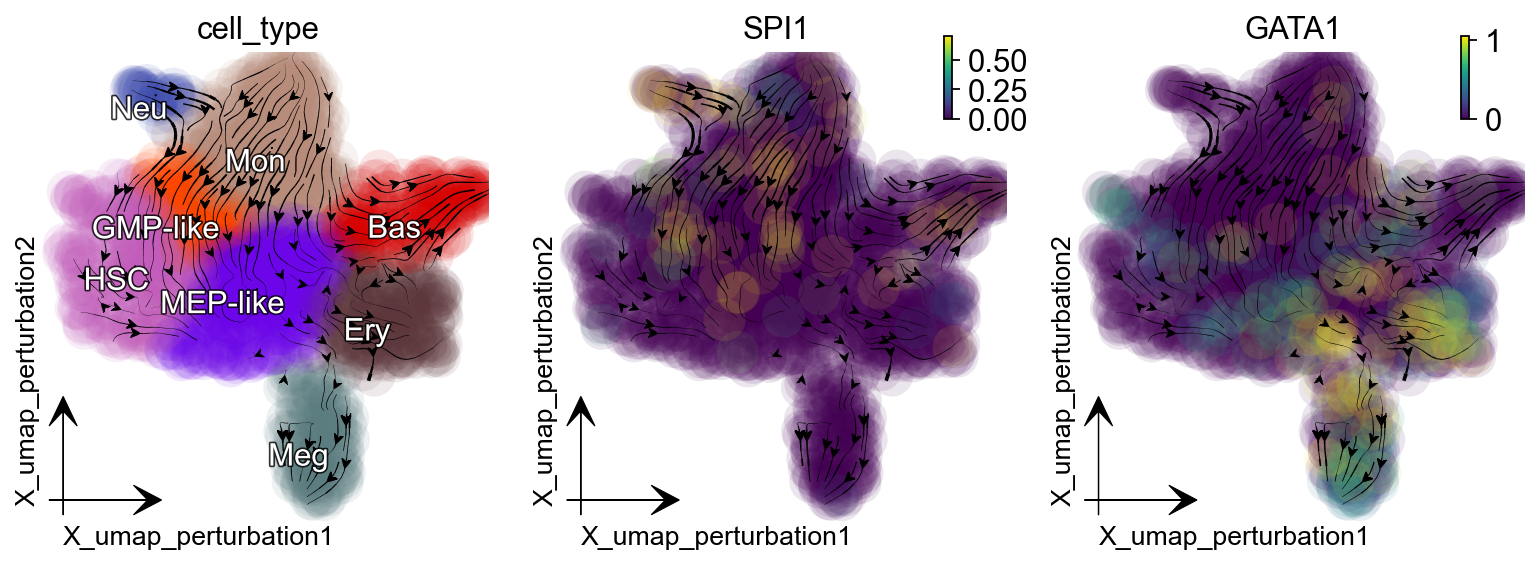
Supress GATA1 and SPI1 genes individually
In the dynamo Cell paper :cite:p:QIU2022, we explored and reported the canonical PU.1/SPI1-GATA1 network motif with new strategies. The streamlines of SPI1 and GATA1 show that HSPCs bifurcate into GMP-like and MEP-like branches. Meanwhile, GATA1 is the master regulator of the GMP lineage. Here we select GATA1 and SPI1 for perturbation analysis example.
Suppression of GATA1 diverts cells from GMP-related lineages to MEP-related lineages.
gene = "GATA1"
dyn.pd.perturbation(adata_labeling, gene, [-100], emb_basis="umap")
|-----> In silico perturbation of single-cells and prediction of cell fate after perturbation...
|-----> Retrive X_pca, PCs, pca_mean...
|-----> Calculate perturbation effect matrix via \delta Y = J \dot \delta X....
|-----> project the pca perturbation vector to low dimensional space....
|-----> [projecting velocity vector to low dimensional embedding] in progress: 100.0000%|-----> [projecting velocity vector to low dimensional embedding] completed [0.5547s]
|-----> method arg is None, choosing methods automatically...
|-----------> method kd_tree selected
|-----> you can use dyn.pl.streamline_plot(adata, basis='umap_perturbation') to visualize the perturbation vector
dyn.pl.streamline_plot(adata_labeling, color=["cell_type", gene],
                       basis="umap_perturbation",figsize=(4,4),
                       s_kwargs_dict={'adjust_legend':True,'dpi':80}
                      )
|-----> method arg is None, choosing methods automatically...
|-----------> method kd_tree selected
|-----------> plotting with basis key=X_umap_perturbation
|-----------> skip filtering cell_type by stack threshold when stacking color because it is not a numeric type
|-----------> plotting with basis key=X_umap_perturbation
Suppression of SPI1 diverts cells from MEP-related lineages to GMP-related lineages.
gene = "SPI1"
dyn.pd.perturbation(adata_labeling, gene, [-100], emb_basis="umap")
|-----> In silico perturbation of single-cells and prediction of cell fate after perturbation...
|-----> Retrive X_pca, PCs, pca_mean...
|-----> Calculate perturbation effect matrix via \delta Y = J \dot \delta X....
|-----> project the pca perturbation vector to low dimensional space....
|-----> [projecting velocity vector to low dimensional embedding] in progress: 100.0000%|-----> [projecting velocity vector to low dimensional embedding] completed [0.6314s]
|-----> method arg is None, choosing methods automatically...
|-----------> method kd_tree selected
|-----> you can use dyn.pl.streamline_plot(adata, basis='umap_perturbation') to visualize the perturbation vector
dyn.pl.streamline_plot(adata_labeling, color=["cell_type", gene],
                       basis="umap_perturbation",figsize=(4,4),
                      s_kwargs_dict={'adjust_legend':True,'dpi':80})
|-----> method arg is None, choosing methods automatically...
|-----------> method kd_tree selected
|-----------> plotting with basis key=X_umap_perturbation
|-----------> skip filtering cell_type by stack threshold when stacking color because it is not a numeric type
|-----------> plotting with basis key=X_umap_perturbation
Supress SPI1/GATA at the same time
Suppression of both SPI1 and GATA1 traps cells in the progenitor states. This behavior is different from the cases in which we perturb SPI1 and GATA1 individually.
selected_genes =  [ "SPI1", "GATA1"]
# expr_vals = [-100, -100]
expr_vals = [-100, -15]
dyn.pd.perturbation(adata_labeling, selected_genes, expr_vals, emb_basis="umap")
dyn.pl.streamline_plot(adata_labeling, color=["cell_type"] + selected_genes,
                       basis="umap_perturbation",figsize=(4,4),
                      s_kwargs_dict={'adjust_legend':True,'dpi':80})
|-----> In silico perturbation of single-cells and prediction of cell fate after perturbation...
|-----> Retrive X_pca, PCs, pca_mean...
|-----> Calculate perturbation effect matrix via \delta Y = J \dot \delta X....
|-----> project the pca perturbation vector to low dimensional space....
|-----> [projecting velocity vector to low dimensional embedding] in progress: 100.0000%|-----> [projecting velocity vector to low dimensional embedding] completed [0.5555s]
|-----> method arg is None, choosing methods automatically...
|-----------> method kd_tree selected
|-----> you can use dyn.pl.streamline_plot(adata, basis='umap_perturbation') to visualize the perturbation vector
|-----> method arg is None, choosing methods automatically...
|-----------> method kd_tree selected
|-----------> plotting with basis key=X_umap_perturbation
|-----------> skip filtering cell_type by stack threshold when stacking color because it is not a numeric type
|-----------> plotting with basis key=X_umap_perturbation
|-----------> plotting with basis key=X_umap_perturbation
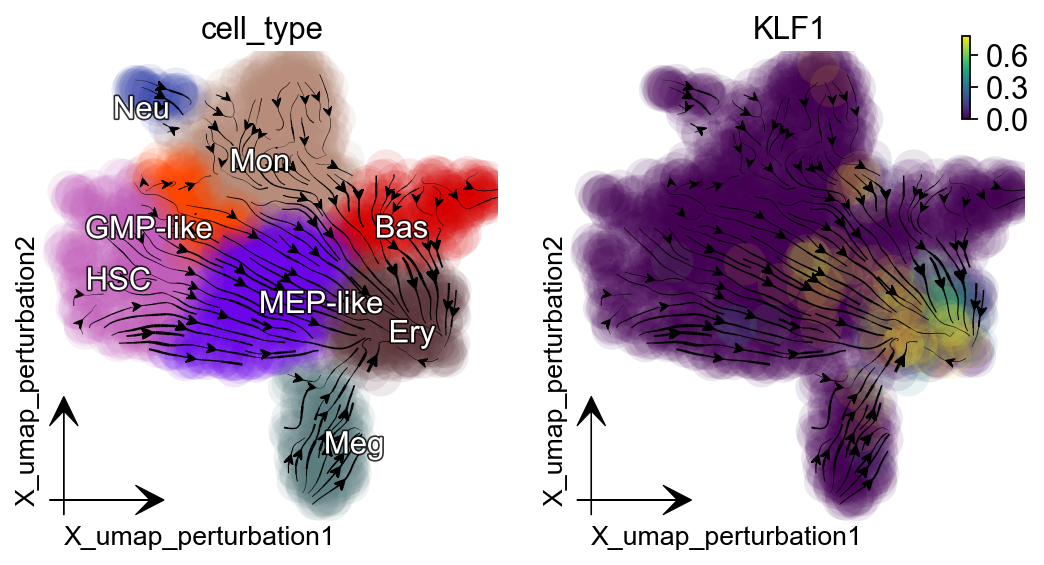
Activate KLF1
Dynamo in silico perturbation can correctly predict other cellular transitions, showcased in :cite:p:QIU2022. Here is another example: activating KLF1 leads to conversion into erythroid cells, consistent with :cite:p:Orkin2008-vp.
gene = "KLF1"
dyn.pd.perturbation(adata_labeling, gene, [100], emb_basis="umap")
dyn.pl.streamline_plot(adata_labeling, color=["cell_type", gene],
                       basis="umap_perturbation",figsize=(4,4),
                      s_kwargs_dict={'adjust_legend':True,'dpi':80})
|-----> In silico perturbation of single-cells and prediction of cell fate after perturbation...
|-----> Retrive X_pca, PCs, pca_mean...
|-----> Calculate perturbation effect matrix via \delta Y = J \dot \delta X....
|-----> project the pca perturbation vector to low dimensional space....
|-----> [projecting velocity vector to low dimensional embedding] in progress: 100.0000%|-----> [projecting velocity vector to low dimensional embedding] completed [0.5419s]
|-----> method arg is None, choosing methods automatically...
|-----------> method kd_tree selected
|-----> you can use dyn.pl.streamline_plot(adata, basis='umap_perturbation') to visualize the perturbation vector
|-----> method arg is None, choosing methods automatically...
|-----------> method kd_tree selected
|-----------> plotting with basis key=X_umap_perturbation
|-----------> skip filtering cell_type by stack threshold when stacking color because it is not a numeric type
|-----------> plotting with basis key=X_umap_perturbation
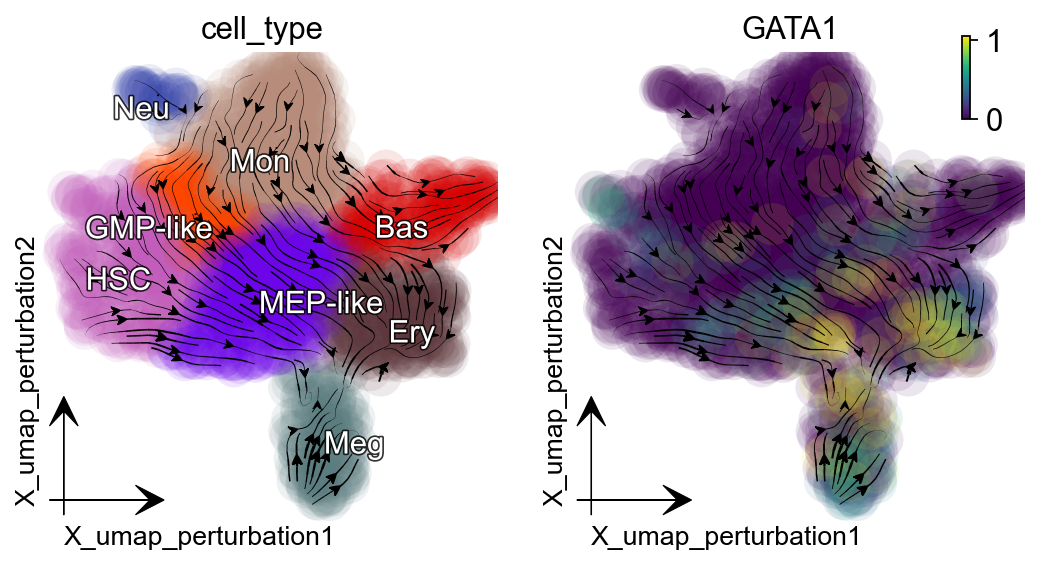
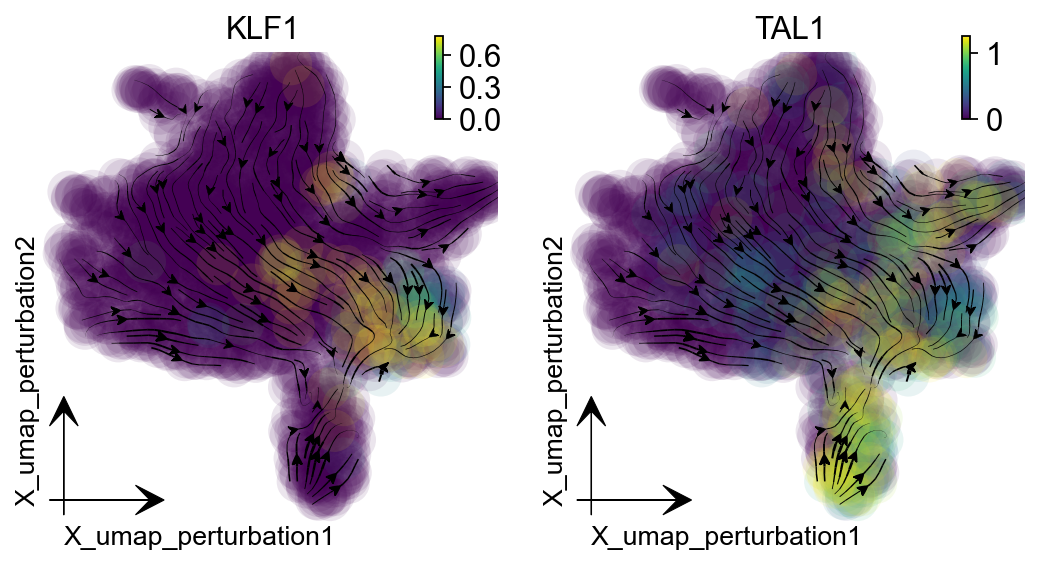
Promote erythroid lineage: triple activation
Triple activation of GATA1, KLF1, and TAL1, known erythrocyte factors, and TFs used for reprogramming fibroblasts into erythrocytes, diverts most other cells into the Ery lineage (Capellera-Garcia et al., 2016).
selected_genes =  ["GATA1", "KLF1", "TAL1"]
expr_vals = [100, 100, 100]
dyn.pd.perturbation(adata_labeling, selected_genes, expr_vals, emb_basis="umap")
dyn.pl.streamline_plot(adata_labeling, color=["cell_type",selected_genes[0]],
                       basis="umap_perturbation", figsize=(4, 4),
                      s_kwargs_dict={'adjust_legend':True,'dpi':80})
dyn.pl.streamline_plot(adata_labeling, color=selected_genes[1:],
                       basis="umap_perturbation", figsize=(4, 4),
                      s_kwargs_dict={'adjust_legend':True,'dpi':80})
|-----> In silico perturbation of single-cells and prediction of cell fate after perturbation...
|-----> Retrive X_pca, PCs, pca_mean...
|-----> Calculate perturbation effect matrix via \delta Y = J \dot \delta X....
|-----> project the pca perturbation vector to low dimensional space....
|-----> [projecting velocity vector to low dimensional embedding] in progress: 100.0000%|-----> [projecting velocity vector to low dimensional embedding] completed [0.5342s]
|-----> method arg is None, choosing methods automatically...
|-----------> method kd_tree selected
|-----> you can use dyn.pl.streamline_plot(adata, basis='umap_perturbation') to visualize the perturbation vector
|-----> method arg is None, choosing methods automatically...
|-----------> method kd_tree selected
|-----------> plotting with basis key=X_umap_perturbation
|-----------> skip filtering cell_type by stack threshold when stacking color because it is not a numeric type
|-----------> plotting with basis key=X_umap_perturbation
|-----> method arg is None, choosing methods automatically...
|-----------> method kd_tree selected
|-----------> plotting with basis key=X_umap_perturbation
|-----------> plotting with basis key=X_umap_perturbation